


When Moses led the Children of Israel out of Egypt and Slavery he commanded them to load up their camels and mount up their asses. We are going to the Promised Land! He said.
When FDR led the People of America out of the Depression he commanded the workers to sit on their asses and light up their Camels. This is the Promised Land! He said.
ruveyn


For everyone. We just have a group of people who honestly don't think that government should be funded at all. They think the laffer curve isnt a curve but a stairway to heaven. If they were taxed at 1% they'd be crying within a year that Stalin was oppresing them and that road repair was a communist plot. An anti-tax cult.
Everyone is getting a free lunch right now. We are not paying for the services we get, let alone the unfunded wars.
Everyone is getting a free lunch right now. We are not paying for the services we get, let alone the unfunded wars.
Glad we're on the same page about that.
Greece is an example of why taxes need to be paid.
I think it is possible to have low taxes, but that can only exist with low government spending (something they don't like).
Just as much as taxes will have to be higher to adjust to high government spending. I believe tax has to be relative not just X rate all of the time for everyone. US history has shown tax rates to rise and fall but usually at the wrong times of their history. When in wars, they should be taxing higher to cover military spending.
Jacoby
Veteran
![]()
Joined: 10 Dec 2007
Age: 32
Gender: Male
Posts: 14,284
Location: Permanently banned by power tripping mods lol this forum is trash
Looks about the same.

The tax rates people trumpet a lot of the times are a pretty gross misrepresentation. The 94% on income over $200,000 in 1945 or whenever that was would be the equivalent to about $2.5 million now. The top 1% of income earners now start at about $350,000 and there is a big difference between that and $2,500,000. Safe to say, the very very few people making over $200,000 in 1945 weren't actually paying 94% of their income. The were so many loopholes, exemptions, and deductions that the actual rate wasn't anywhere close to the what the marginal tax rate were.

Looks about the same.
The tax rates people trumpet a lot of the times are a pretty gross misrepresentation. The 94% on income over $200,000 in 1945 or whenever that was would be the equivalent to about $2.5 million now. The top 1% of income earners now start at about $350,000 and there is a big difference between that and $2,500,000. Safe to say, the very very few people making over $200,000 in 1945 weren't actually paying 94% of their income. The were so many loopholes, exemptions, and deductions that the actual rate wasn't anywhere close to the what the marginal tax rate were.
Interestingly, the quadrupling of GDP relative revenue corresponds almost perfectly with the end of the first Great Depression. I'm not saying it's possible have tax revenue at more than 50% of GDP.
"The idea that taxes are high right now is pretty much nuts," says Michael Ettlinger, head of economic policy at the liberal Center for American Progress
Then another story in 2011:
By contrast, individuals spent roughly 27% of income on taxes in the 1970s, 1980s and the 1990s — a rate that would mean $500 billion of extra taxes annually today, one-third of the estimated $1.5 trillion federal deficit this year.
The Bush and Reagan tax cuts were real. It's not a conspiracy of historians. Credits have also been added and extended. Capital gains taxes are also low right now. Something that Warren Buffet has been talking about. The CBO, Buffet, Greenspan and even Reagan's former budget director David Stockman are all noting that we are paying too little in taxes right now. It's silly. You can't live on your grandchildren's tax base and call it principled. The bills are very real.
http://www.usatoday.com/money/perfi/tax ... -low_n.htm
http://www.politifact.com/truth-o-meter ... 50s-ceos-/
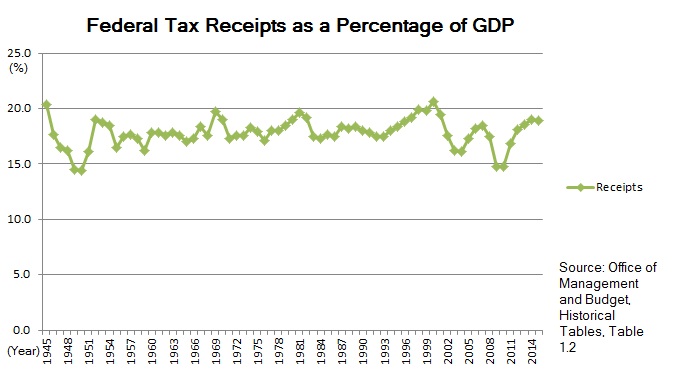
Your charts are quite different. Look at the ends. One shows tax revenue heading down, one heading up. That's because one OMB chart is a projection of what will happen through 2017 after the Bush cuts expire (as legally they are set to do this year). The CBO has similar charts. They have to assume the law is the law and will expire as intended.
So as evidence that taxes are high you are using future projections of what things might look like if the Bush cuts expire (and the economy recovers). That's silly. Setting aside that they won't likely expire as intended and there will be another deal. If they don't expire at some point we are in big trouble, as CBO points out.
To be honest, most of the rise on the chart corresponds better to increase in military expenditure because of the Second World War. It increases a bit in the 1930s, but jumps in the early 40s.
Jacoby
Veteran
![]()
Joined: 10 Dec 2007
Age: 32
Gender: Male
Posts: 14,284
Location: Permanently banned by power tripping mods lol this forum is trash
Any sensible person would agree that there is more of a spending problem than a taxing problem. Even in the article you posted with all those old taxes it would only provide $500 billion in extra revenue and that's according to them. That would still leave a trillion dollar deficit.
The debt problem is a very serious problem and will destroy our economy if it it not taken care of very very soon. The interest on our debt is getting close to that $500 billion and will probably overtake defense spending by the end of the decade. The hole our country is in right now is so astronomical, I'm not sure there is any scenario where our government doesn't default on it's debt eventually.
Jacoby
Veteran
![]()
Joined: 10 Dec 2007
Age: 32
Gender: Male
Posts: 14,284
Location: Permanently banned by power tripping mods lol this forum is trash
To be honest, most of the rise on the chart corresponds better to increase in military expenditure because of the Second World War. It increases a bit in the 1930s, but jumps in the early 40s.
The rest of the world being reduced to rubble because of WWII did it as opposed to the spending on the military.
Jacoby
Veteran
![]()
Joined: 10 Dec 2007
Age: 32
Gender: Male
Posts: 14,284
Location: Permanently banned by power tripping mods lol this forum is trash
Your charts are quite different. Look at the ends. One shows tax revenue heading down, one heading up. That's because one OMB chart is a projection of what will happen through 2017 after the Bush cuts expire (as legally they are set to do this year). The CBO has similar charts. They have to assume the law is the law and will expire as intended.
So as evidence that taxes are high you are using future projections of what things might look like if the Bush cuts expire (and the economy recovers). That's silly. Setting aside that they won't likely expire as intended and there will be another deal. If they don't expire at some point we are in big trouble, as CBO points out.
One ends in 2009 the other ends in 2014. The drop in revenue corresponds exactly the same time the crash happened.
The longer chart goes to 2016. The CBO includes a description of a similar chart here, which goes out to 2017: They explain what I just explained about the effect of the Bush cuts on the graph.
http://cbo.gov/publication/21938
Believe whatever you like. Good luck.
Last edited by simon_says on 09 Jul 2012, 5:20 pm, edited 1 time in total.
To be honest, most of the rise on the chart corresponds better to increase in military expenditure because of the Second World War. It increases a bit in the 1930s, but jumps in the early 40s.
The rest of the world being reduced to rubble because of WWII did it as opposed to the spending on the military.
In 1941, the Americans were not allocating funds to reconstruction, surely. It is not very clear on the chart, but the way I read it, there is an increase of 5 points in the 1930s, then of about 15 points in the early 40s, a drop of 5 points in the late 40s, and then it goes back 5 points up after 1949, and stays more or less stable. This also fits the Cold War timeline, btw.
It must be noticed, however, that war spending is often a cause of structural changes in government revenue management. It has been argued that government centralisation in the Late Middle Ages and Early Modern period has been a consequence of wars and of how they stressed finances more and more, especially as artillery became increasingly used. Here, we notice a change in spending and taxing habits which coincides with a major war. I know we should avoid post hoc, ergo propter hoc arguments, but there is something there. Keynesian economics also argued for increased government spending (but only in times of crisis), but that only explains the 5 point increase in the 1930s, up to about 5-7%, not the jump to almost 20%.


